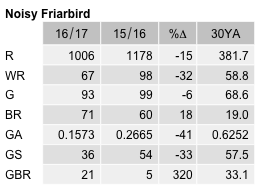
Noisy Friarbird
Philemon corniculatus
ABR description
The following is extracted from the Annual Bird Report for the twelve months to June 2017.
Common, breeding summer migrant
A species mostly of lowland woodland regions.
General: Number of records and reporting rate (7.3%) lower than last year and the 30YA (14.0%). Since 1990, the reporting rate has remained steady around 10%, with high points in 1999 and 2000, but this year is the lowest since 1995. Nearly all records (91%) in spring and summer. Earliest record 1/18 Aug JWNR (LeM1), last 3/15 Apr JWNR (SmA1). Max 50/8 Mar Mulligans Flat (WyP1), mean 2.9, median 2. 72 breeding records, the highest number recorded: the first unusually late nb/17 Nov North Lyneham (LeM1), last dy/19 Feb Campbell Park (BuM4).
GBS: Number of records halved from last year. Recorded at 61% of sites, well below 81% last year and the 30YA of 89%. First record was a month earlier than usual: 1/5wk Jul Florey (BrJ3); last record was also early, 1/5wk Apr Curtin GrK14 (AjR1). Max 10/1wk Sep Narrabundah (PaR9). Abundance (A=0.1573) was the lowest recorded, well below last year and now 75% below the 30YA. From a peak of A=1.23 in 2000, the species has recorded a steady decline in the GBS. However, the 21 breeding records was a big improvement on last year’s 5: first di/2wk Sept Curtin (AjR1), last dy/5wk Jan Curtin (AjR1).
Abundance
Abundance is the average number of birds of that species per survey. Where the species was observed (presence recorded) but the number of birds seen was not recorded, this is treated as a count of zero.
Abundance by year
This chart shows the abundance of Noisy Friarbird between 1982 and 2017. 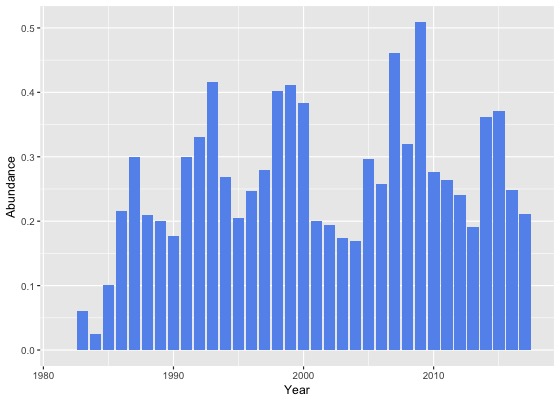
Abundance by month
This chart shows the monthly abundance of Noisy Friarbird. The blue lines show the abundance for the twelve months to June 2017 and the bars show the average abundance for the period 1982 to 2017. 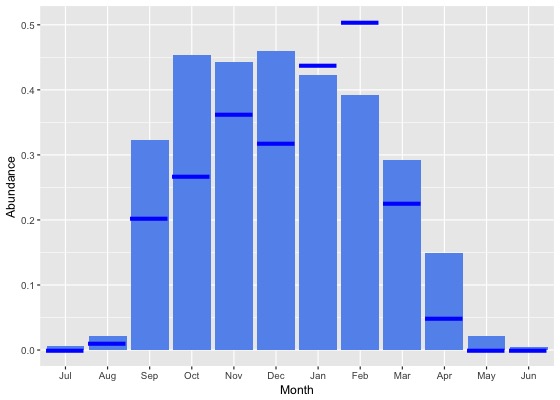
Abundance by season
This chart shows the seasonal abundance of Noisy Friarbird. The blue lines show the seasonal abundance for the twelve months to June 2017 and the bars show the average seasonal abundance for the period 1982 to 2017. 
Abundance data
| Month | Season | ||||||||||||||||||
|---|---|---|---|---|---|---|---|---|---|---|---|---|---|---|---|---|---|---|---|
| Period | Jul | Aug | Sep | Oct | Nov | Dec | Jan | Feb | Mar | Apr | May | Jun | Winter | Spring | Summer | Autumn | All | ||
| All years | |||||||||||||||||||
| All | 0.0 | 0.0 | 0.3 | 0.5 | 0.4 | 0.5 | 0.4 | 0.4 | 0.3 | 0.1 | 0.0 | 0.0 | 0.0 | 0.4 | 0.4 | 0.2 | 0.3 | ||
| Previous years | |||||||||||||||||||
| All previous years | 0.0 | 0.0 | 0.3 | 0.5 | 0.5 | 0.5 | 0.4 | 0.4 | 0.3 | 0.2 | 0.0 | 0.0 | 0.0 | 0.4 | 0.4 | 0.2 | 0.3 | ||
| Previous 30 years | 0.0 | 0.0 | 0.3 | 0.5 | 0.5 | 0.5 | 0.4 | 0.4 | 0.3 | 0.2 | 0.0 | 0.0 | 0.0 | 0.4 | 0.4 | 0.2 | 0.3 | ||
| Previous 20 years | 0.0 | 0.0 | 0.4 | 0.5 | 0.5 | 0.5 | 0.4 | 0.4 | 0.3 | 0.2 | 0.0 | 0.0 | 0.0 | 0.4 | 0.4 | 0.2 | 0.3 | ||
| 10 year groups | |||||||||||||||||||
| [2007,2017) | 0.0 | 0.0 | 0.4 | 0.5 | 0.5 | 0.5 | 0.4 | 0.4 | 0.3 | 0.1 | 0.0 | 0.0 | 0.0 | 0.5 | 0.4 | 0.2 | 0.3 | ||
| [1997,2007) | 0.0 | 0.0 | 0.3 | 0.4 | 0.4 | 0.5 | 0.4 | 0.4 | 0.3 | 0.2 | 0.1 | 0.0 | 0.0 | 0.3 | 0.4 | 0.2 | 0.3 | ||
| [1987,1997) | 0.0 | 0.0 | 0.2 | 0.4 | 0.4 | 0.4 | 0.4 | 0.4 | 0.4 | 0.2 | 0.0 | 0.0 | 0.0 | 0.4 | 0.4 | 0.2 | 0.2 | ||
| 5 year groups | |||||||||||||||||||
| [2012,2017) | 0.0 | 0.0 | 0.4 | 0.5 | 0.4 | 0.5 | 0.4 | 0.4 | 0.3 | 0.1 | 0.0 | 0.0 | 0.0 | 0.5 | 0.4 | 0.1 | 0.3 | ||
| [2007,2012) | 0.0 | 0.0 | 0.4 | 0.5 | 0.7 | 0.6 | 0.6 | 0.4 | 0.3 | 0.2 | 0.1 | 0.0 | 0.0 | 0.5 | 0.6 | 0.2 | 0.4 | ||
| [2002,2007) | 0.0 | 0.0 | 0.3 | 0.2 | 0.4 | 0.4 | 0.3 | 0.4 | 0.2 | 0.2 | 0.0 | 0.0 | 0.0 | 0.3 | 0.3 | 0.2 | 0.2 | ||
| [1997,2002) | 0.0 | 0.1 | 0.3 | 0.5 | 0.4 | 0.6 | 0.5 | 0.4 | 0.5 | 0.3 | 0.1 | 0.0 | 0.0 | 0.4 | 0.5 | 0.3 | 0.3 | ||
| [1992,1997) | 0.0 | 0.0 | 0.2 | 0.5 | 0.5 | 0.7 | 0.4 | 0.3 | 0.4 | 0.1 | 0.0 | 0.0 | 0.0 | 0.4 | 0.5 | 0.2 | 0.3 | ||
| [1987,1992) | 0.0 | 0.0 | 0.3 | 0.4 | 0.3 | 0.3 | 0.4 | 0.4 | 0.4 | 0.2 | 0.0 | 0.0 | 0.0 | 0.3 | 0.4 | 0.2 | 0.2 | ||
| Year | |||||||||||||||||||
| 2017 | 0.0 | 0.0 | 0.2 | 0.3 | 0.4 | 0.3 | 0.4 | 0.5 | 0.2 | 0.0 | 0.0 | 0.0 | 0.0 | 0.3 | 0.4 | 0.1 | 0.2 | ||
| 2016 | 0.0 | 0.0 | 0.4 | 0.4 | 0.4 | 0.5 | 0.5 | 0.2 | 0.3 | 0.0 | 0.0 | 0.0 | 0.0 | 0.4 | 0.4 | 0.1 | 0.2 | ||
| 2015 | 0.0 | 0.0 | 0.5 | 0.8 | 0.5 | 0.5 | 0.5 | 0.6 | 0.3 | 0.3 | 0.0 | 0.0 | 0.0 | 0.6 | 0.5 | 0.2 | 0.4 | ||
| 2014 | 0.0 | 0.0 | 0.7 | 0.6 | 0.6 | 0.3 | 0.5 | 0.5 | 0.5 | 0.0 | 0.0 | 0.0 | 0.0 | 0.6 | 0.4 | 0.2 | 0.4 | ||
| 2013 | 0.0 | 0.0 | 0.1 | 0.3 | 0.4 | 0.3 | 0.3 | 0.3 | 0.1 | 0.1 | 0.0 | 0.0 | 0.0 | 0.3 | 0.3 | 0.1 | 0.2 | ||
| 2012 | 0.0 | 0.1 | 0.4 | 0.5 | 0.4 | 0.5 | 0.2 | 0.3 | 0.2 | 0.0 | 0.0 | 0.0 | 0.0 | 0.4 | 0.3 | 0.1 | 0.2 | ||
| 2011 | 0.0 | 0.0 | 0.4 | 0.5 | 0.4 | 0.3 | 0.4 | 0.4 | 0.1 | 0.2 | 0.1 | 0.0 | 0.0 | 0.5 | 0.4 | 0.1 | 0.3 | ||
| 2010 | 0.0 | 0.0 | 0.1 | 0.3 | 0.6 | 0.4 | 0.5 | 0.5 | 0.5 | 0.1 | 0.0 | 0.0 | 0.0 | 0.3 | 0.4 | 0.2 | 0.3 | ||
| 2009 | 0.1 | 0.0 | 0.8 | 0.8 | 0.8 | 0.8 | 0.6 | 0.4 | 0.2 | 0.3 | 0.0 | 0.0 | 0.0 | 0.8 | 0.6 | 0.2 | 0.5 | ||
| 2008 | 0.0 | 0.0 | 0.1 | 0.4 | 0.6 | 0.7 | 0.7 | 0.3 | 0.4 | 0.2 | 0.2 | 0.1 | 0.0 | 0.4 | 0.6 | 0.2 | 0.3 | ||
| 2007 | 0.0 | 0.1 | 0.6 | 0.5 | 1.1 | 1.2 | 0.8 | 0.2 | 0.2 | 0.2 | 0.0 | 0.0 | 0.0 | 0.7 | 0.9 | 0.1 | 0.5 | ||
| 2006 | 0.0 | 0.0 | 0.3 | 0.4 | 0.5 | 0.4 | 0.5 | 0.4 | 0.3 | 0.1 | 0.0 | 0.0 | 0.0 | 0.4 | 0.4 | 0.2 | 0.3 | ||
| 2005 | 0.0 | 0.0 | 0.5 | 0.2 | 0.4 | 0.5 | 0.3 | 0.6 | 0.3 | 0.5 | 0.0 | 0.0 | 0.0 | 0.4 | 0.5 | 0.3 | 0.3 | ||
| 2004 | 0.0 | 0.0 | 0.1 | 0.1 | 0.4 | 0.3 | 0.3 | 0.3 | 0.1 | 0.4 | 0.0 | 0.0 | 0.0 | 0.2 | 0.3 | 0.2 | 0.2 | ||
| 2003 | 0.0 | 0.0 | 0.1 | 0.2 | 0.4 | 0.4 | 0.2 | 0.4 | 0.1 | 0.0 | 0.2 | 0.0 | 0.0 | 0.2 | 0.3 | 0.1 | 0.2 | ||
| 2002 | 0.0 | 0.0 | 0.4 | 0.1 | 0.2 | 0.3 | 0.2 | 0.2 | 0.4 | 0.0 | 0.0 | 0.0 | 0.0 | 0.3 | 0.3 | 0.2 | 0.2 | ||
| 2001 | 0.0 | 0.0 | 0.1 | 0.2 | 0.3 | 0.5 | 0.3 | 0.3 | 0.3 | 0.2 | 0.0 | 0.0 | 0.0 | 0.2 | 0.4 | 0.2 | 0.2 | ||
| 2000 | 0.0 | 0.2 | 0.5 | 0.6 | 0.4 | 0.6 | 0.5 | 0.6 | 0.4 | 0.3 | 0.0 | 0.0 | 0.1 | 0.5 | 0.6 | 0.3 | 0.4 | ||
| 1999 | 0.0 | 0.1 | 0.4 | 0.3 | 0.6 | 0.7 | 0.9 | 0.4 | 0.8 | 0.4 | 0.2 | 0.0 | 0.0 | 0.4 | 0.7 | 0.5 | 0.4 | ||
| 1998 | 0.1 | 0.0 | 0.4 | 1.5 | 0.5 | 0.6 | 0.1 | 0.4 | 0.2 | 0.0 | 0.0 | 0.0 | 0.0 | 0.8 | 0.4 | 0.1 | 0.4 | ||
| 1997 | 0.0 | 0.1 | 0.1 | 0.4 | 0.5 | 0.3 | 0.3 | 0.2 | 1.6 | 0.3 | 0.0 | 0.0 | 0.0 | 0.3 | 0.2 | 0.5 | 0.3 | ||
| 1996 | 0.0 | 0.0 | 0.3 | 0.4 | 0.5 | 0.7 | 0.3 | 0.1 | 0.2 | 0.0 | 0.0 | 0.0 | 0.0 | 0.4 | 0.4 | 0.1 | 0.2 | ||
| 1995 | 0.0 | 0.0 | 0.1 | 0.3 | 0.3 | 0.5 | 0.5 | 0.2 | 0.3 | 0.2 | 0.0 | 0.0 | 0.0 | 0.2 | 0.4 | 0.2 | 0.2 | ||
| 1994 | 0.0 | 0.1 | 0.5 | 0.4 | 0.3 | 0.6 | 0.8 | 0.1 | 0.5 | 0.1 | 0.0 | 0.0 | 0.0 | 0.4 | 0.5 | 0.2 | 0.3 | ||
| 1993 | 0.0 | 0.0 | 0.0 | 0.8 | 1.3 | 1.3 | 0.3 | 1.5 | 0.3 | 0.1 | 0.1 | 0.0 | 0.0 | 0.7 | 1.0 | 0.2 | 0.4 | ||
| 1992 | 0.0 | 0.0 | 0.1 | 0.7 | 0.8 | 0.5 | 0.1 | 0.4 | 0.8 | 0.3 | 0.1 | 0.0 | 0.0 | 0.5 | 0.3 | 0.4 | 0.3 | ||
| 1991 | 0.0 | 0.0 | 0.1 | 0.5 | 0.3 | 0.5 | 0.5 | 1.6 | 0.3 | 0.2 | 0.0 | 0.0 | 0.0 | 0.3 | 0.8 | 0.2 | 0.3 | ||
| 1990 | 0.0 | 0.0 | 0.0 | 0.2 | 0.2 | 0.2 | 0.3 | 0.3 | 0.5 | 0.7 | 0.0 | 0.0 | 0.0 | 0.1 | 0.3 | 0.4 | 0.2 | ||
| 1989 | 0.0 | 0.0 | 0.2 | 0.4 | 0.3 | 0.3 | 0.3 | 0.2 | 0.3 | 0.1 | 0.0 | 0.0 | 0.0 | 0.3 | 0.3 | 0.2 | 0.2 | ||
| 1988 | 0.0 | 0.0 | 0.4 | 0.3 | 0.3 | 0.3 | 0.3 | 0.3 | 0.4 | 0.2 | 0.0 | 0.0 | 0.0 | 0.3 | 0.3 | 0.2 | 0.2 | ||
| 1987 | 0.0 | 0.0 | 0.3 | 0.5 | 0.4 | 0.4 | 0.5 | 0.3 | 0.3 | 0.2 | 0.0 | 0.0 | 0.0 | 0.4 | 0.4 | 0.2 | 0.3 | ||
| 1986 | 0.0 | 0.0 | 0.2 | 0.8 | 0.5 | 0.3 | 0.2 | 0.2 | 0.1 | 0.3 | 0.0 | 0.0 | 0.0 | 0.4 | 0.2 | 0.1 | 0.2 | ||
| 1985 | 0.0 | 0.2 | 0.0 | 0.2 | 0.2 | 0.1 | 0.1 | 0.2 | 0.0 | 0.0 | 0.0 | 0.0 | 0.1 | 0.1 | 0.1 | 0.0 | 0.1 | ||
| 1984 | 0.0 | 0.0 | 0.0 | 0.0 | 0.0 | 0.0 | 0.0 | 0.0 | 0.2 | 0.0 | 0.0 | 0.0 | 0.0 | 0.0 | 0.0 | 0.1 | 0.0 | ||
| 1983 | 0.0 | 0.0 | 0.0 | 0.0 | 0.3 | 0.2 | 0.0 | 0.1 | 0.0 | - | 0.0 | 0.0 | 0.0 | 0.1 | 0.1 | 0.0 | 0.1 | ||
| 1982 | - | 0.0 | - | 0.0 | 0.0 | 0.0 | - | 0.0 | - | 0.0 | - | 0.0 | 0.0 | 0.0 | 0.0 | 0.0 | 0.0 | ||
Reporting rates
Reporting rate is the proportion of all surveys in which the species was present.
Reporting rate by year
This chart shows the reporting rate of Noisy Friarbird each year between 1982 and 2017. 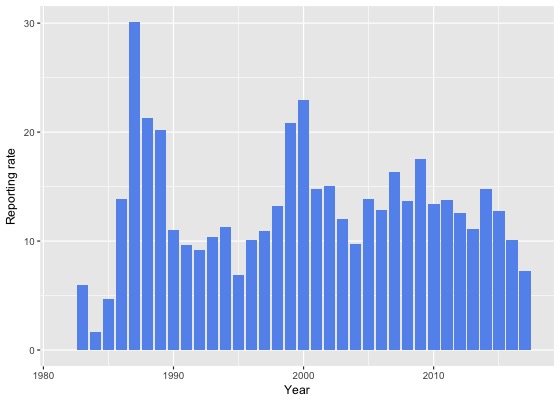
Reporting rate by month
This chart shows the reporting rate by month of Noisy Friarbird. The blue lines show the reporting rate for the twelve months to June 2017 and the bars show the average reporting rate for the period 1982 to 2017. 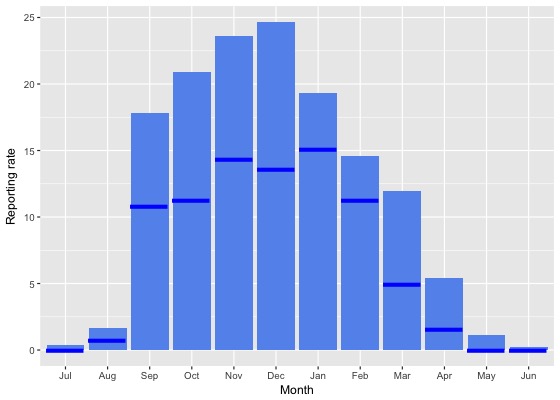
Reporting rate by season
This chart shows the seasonal reporting rate of Noisy Friarbird. The blue lines show the seasonal reporting rate for the twelve months to June 2017 and the bars show the average seasonal reporting rate for the period 1982 to 2017. 
Reporting rate data
| Month | Season | ||||||||||||||||||
|---|---|---|---|---|---|---|---|---|---|---|---|---|---|---|---|---|---|---|---|
| Period | Jul | Aug | Sep | Oct | Nov | Dec | Jan | Feb | Mar | Apr | May | Jun | Winter | Spring | Summer | Autumn | All | ||
| All years | |||||||||||||||||||
| All | 0.3 | 1.7 | 17.8 | 20.9 | 23.6 | 24.6 | 19.3 | 14.6 | 12.0 | 5.4 | 1.1 | 0.2 | 0.7 | 20.7 | 19.8 | 6.8 | 12.9 | ||
| Previous years | |||||||||||||||||||
| All previous years | 0.4 | 1.9 | 18.8 | 22.2 | 25.1 | 26.3 | 20.1 | 15.3 | 13.2 | 6.0 | 1.4 | 0.3 | 0.8 | 21.9 | 21.0 | 7.6 | 13.9 | ||
| Previous 30 years | 0.4 | 1.9 | 19.0 | 22.4 | 25.2 | 26.6 | 20.2 | 15.4 | 13.2 | 6.0 | 1.4 | 0.3 | 0.8 | 22.1 | 21.2 | 7.6 | 14.0 | ||
| Previous 20 years | 0.3 | 1.8 | 18.5 | 21.1 | 25.0 | 26.4 | 19.3 | 13.8 | 11.3 | 4.7 | 1.1 | 0.3 | 0.7 | 21.3 | 20.4 | 6.4 | 13.4 | ||
| 10 year groups | |||||||||||||||||||
| [2007,2017) | 0.3 | 1.1 | 17.7 | 22.0 | 24.0 | 24.8 | 18.4 | 12.1 | 9.0 | 3.4 | 0.4 | 0.3 | 0.5 | 21.2 | 18.8 | 4.9 | 12.7 | ||
| [1997,2007) | 0.4 | 3.5 | 20.0 | 17.9 | 27.0 | 29.5 | 22.2 | 18.1 | 16.1 | 8.0 | 2.7 | 0.2 | 1.2 | 21.3 | 24.3 | 10.1 | 14.9 | ||
| [1987,1997) | 0.7 | 2.1 | 21.8 | 29.6 | 25.8 | 27.6 | 25.5 | 22.9 | 24.2 | 12.8 | 2.6 | 0.3 | 1.1 | 26.0 | 25.4 | 13.5 | 17.0 | ||
| 5 year groups | |||||||||||||||||||
| [2012,2017) | 0.1 | 0.9 | 16.9 | 21.7 | 22.0 | 22.6 | 17.9 | 11.6 | 8.5 | 2.9 | 0.1 | 0.0 | 0.3 | 20.3 | 17.5 | 4.4 | 11.9 | ||
| [2007,2012) | 0.7 | 1.6 | 19.6 | 22.6 | 29.5 | 29.5 | 20.3 | 14.2 | 10.6 | 4.8 | 1.3 | 0.7 | 0.9 | 23.1 | 23.0 | 6.1 | 14.9 | ||
| [2002,2007) | 0.5 | 1.3 | 20.2 | 15.6 | 25.4 | 26.4 | 18.4 | 14.5 | 12.3 | 5.0 | 1.1 | 0.2 | 0.6 | 20.0 | 21.1 | 7.3 | 12.7 | ||
| [1997,2002) | 0.4 | 6.1 | 19.6 | 21.3 | 28.9 | 33.5 | 26.4 | 21.7 | 21.2 | 11.5 | 4.7 | 0.3 | 2.0 | 23.0 | 28.0 | 13.8 | 17.8 | ||
| [1992,1997) | 0.3 | 2.1 | 11.7 | 16.3 | 17.7 | 21.1 | 11.5 | 10.8 | 10.7 | 4.8 | 2.2 | 0.0 | 0.9 | 15.5 | 14.5 | 6.1 | 9.4 | ||
| [1987,1992) | 0.8 | 2.1 | 26.5 | 36.9 | 29.7 | 30.4 | 33.2 | 27.5 | 32.2 | 17.3 | 2.8 | 0.4 | 1.2 | 31.2 | 30.4 | 17.6 | 20.8 | ||
| Year | |||||||||||||||||||
| 2017 | 0.0 | 0.7 | 10.8 | 11.3 | 14.4 | 13.6 | 15.1 | 11.2 | 5.0 | 1.6 | 0.0 | 0.0 | 0.2 | 12.1 | 13.4 | 2.3 | 7.3 | ||
| 2016 | 0.0 | 0.0 | 18.2 | 20.0 | 20.3 | 17.5 | 15.9 | 9.9 | 7.7 | 2.8 | 0.1 | 0.0 | 0.0 | 19.5 | 14.2 | 3.9 | 10.1 | ||
| 2015 | 0.5 | 0.0 | 15.1 | 26.8 | 21.9 | 21.3 | 19.5 | 15.3 | 10.4 | 4.8 | 0.2 | 0.0 | 0.1 | 21.8 | 18.8 | 5.6 | 12.8 | ||
| 2014 | 0.0 | 2.1 | 25.2 | 27.5 | 28.1 | 25.4 | 19.7 | 13.0 | 12.7 | 1.8 | 0.0 | 0.0 | 0.6 | 26.9 | 18.9 | 6.1 | 14.8 | ||
| 2013 | 0.0 | 0.5 | 7.9 | 13.8 | 21.3 | 26.6 | 21.4 | 7.3 | 5.0 | 2.1 | 0.0 | 0.4 | 0.3 | 14.1 | 20.2 | 2.9 | 11.1 | ||
| 2012 | 0.0 | 4.7 | 18.6 | 19.8 | 22.4 | 28.3 | 13.9 | 12.7 | 6.0 | 1.1 | 0.0 | 0.0 | 1.4 | 20.1 | 18.4 | 2.7 | 12.6 | ||
| 2011 | 0.8 | 0.0 | 18.6 | 24.6 | 21.2 | 22.9 | 25.7 | 18.3 | 6.9 | 6.6 | 1.1 | 0.0 | 0.2 | 22.3 | 22.8 | 5.0 | 13.7 | ||
| 2010 | 0.0 | 0.9 | 6.7 | 20.2 | 28.7 | 23.3 | 17.4 | 9.4 | 16.1 | 7.7 | 1.0 | 0.8 | 0.6 | 18.3 | 19.0 | 10.2 | 13.4 | ||
| 2009 | 2.2 | 1.0 | 36.1 | 27.4 | 35.3 | 28.0 | 20.7 | 10.0 | 7.9 | 1.6 | 0.8 | 0.0 | 0.9 | 31.4 | 20.9 | 3.7 | 17.6 | ||
| 2008 | 0.0 | 0.0 | 7.9 | 19.4 | 22.1 | 35.6 | 22.2 | 16.7 | 16.1 | 4.7 | 4.5 | 2.8 | 1.3 | 16.7 | 27.4 | 8.1 | 13.7 | ||
| 2007 | 0.0 | 6.5 | 29.5 | 21.3 | 38.5 | 39.3 | 14.2 | 12.2 | 7.7 | 3.0 | 0.0 | 0.7 | 1.8 | 26.7 | 25.0 | 4.2 | 16.3 | ||
| 2006 | 0.0 | 1.9 | 18.9 | 16.4 | 23.8 | 22.9 | 18.5 | 18.5 | 15.5 | 6.5 | 1.4 | 0.4 | 0.6 | 18.7 | 20.1 | 10.1 | 12.9 | ||
| 2005 | 0.0 | 3.7 | 29.4 | 14.9 | 26.2 | 28.3 | 16.3 | 16.3 | 13.9 | 6.0 | 1.5 | 0.4 | 1.0 | 24.2 | 22.5 | 7.5 | 13.8 | ||
| 2004 | 0.8 | 0.0 | 5.3 | 12.2 | 30.8 | 19.8 | 20.6 | 16.2 | 4.1 | 7.1 | 1.0 | 0.0 | 0.4 | 15.4 | 19.3 | 4.6 | 9.7 | ||
| 2003 | 0.0 | 0.0 | 11.9 | 19.2 | 28.0 | 28.8 | 18.5 | 11.5 | 7.2 | 2.3 | 0.8 | 0.0 | 0.0 | 19.5 | 20.6 | 3.9 | 12.0 | ||
| 2002 | 1.1 | 1.7 | 34.8 | 14.2 | 18.5 | 29.5 | 17.6 | 12.5 | 18.2 | 3.6 | 0.0 | 0.0 | 0.8 | 22.1 | 22.6 | 9.7 | 15.1 | ||
| 2001 | 0.0 | 0.6 | 8.0 | 21.0 | 30.1 | 38.8 | 26.5 | 20.1 | 16.3 | 8.8 | 0.0 | 0.5 | 0.3 | 17.3 | 29.7 | 10.1 | 14.8 | ||
| 2000 | 0.8 | 15.0 | 38.6 | 30.8 | 26.4 | 35.5 | 33.1 | 28.6 | 24.1 | 10.6 | 0.9 | 0.0 | 5.2 | 31.9 | 32.8 | 14.5 | 23.0 | ||
| 1999 | 0.0 | 5.2 | 25.9 | 18.9 | 35.1 | 37.5 | 27.7 | 25.0 | 31.9 | 16.5 | 12.5 | 0.0 | 1.4 | 26.5 | 30.4 | 20.4 | 20.8 | ||
| 1998 | 2.7 | 0.0 | 22.8 | 7.6 | 28.3 | 21.7 | 11.8 | 7.5 | 10.8 | 2.6 | 7.4 | 0.0 | 0.6 | 20.4 | 15.4 | 8.2 | 13.2 | ||
| 1997 | 0.0 | 5.2 | 4.5 | 15.8 | 23.9 | 20.2 | 9.8 | 7.0 | 20.0 | 12.8 | 0.0 | 1.4 | 1.8 | 14.9 | 14.2 | 11.3 | 10.9 | ||
| 1996 | 0.0 | 3.2 | 17.3 | 15.8 | 21.3 | 26.3 | 7.8 | 5.9 | 8.8 | 1.6 | 1.7 | 0.0 | 1.2 | 18.2 | 13.6 | 4.9 | 10.1 | ||
| 1995 | 1.1 | 0.8 | 8.7 | 9.8 | 10.0 | 12.6 | 16.8 | 6.3 | 9.2 | 4.0 | 0.0 | 0.0 | 0.6 | 9.5 | 12.9 | 4.7 | 6.9 | ||
| 1994 | 0.0 | 6.5 | 29.4 | 24.4 | 15.4 | 19.6 | 17.6 | 6.9 | 11.4 | 3.8 | 3.8 | 0.0 | 2.3 | 21.4 | 14.5 | 6.0 | 11.2 | ||
| 1993 | 0.0 | 0.0 | 0.0 | 16.0 | 24.2 | 34.8 | 8.2 | 34.4 | 12.3 | 10.0 | 2.6 | 0.0 | 0.0 | 13.8 | 24.4 | 8.3 | 10.3 | ||
| 1992 | 0.0 | 0.0 | 4.7 | 21.3 | 22.2 | 15.9 | 3.4 | 14.6 | 12.7 | 6.8 | 2.6 | 0.0 | 0.0 | 15.9 | 11.1 | 7.3 | 9.1 | ||
| 1991 | 1.6 | 0.0 | 11.6 | 23.3 | 9.3 | 14.9 | 16.1 | 14.0 | 15.9 | 10.2 | 1.6 | 0.0 | 0.7 | 15.0 | 15.0 | 9.3 | 9.7 | ||
| 1990 | 0.0 | 0.0 | 3.2 | 18.4 | 17.8 | 23.6 | 29.2 | 28.2 | 26.1 | 7.1 | 2.7 | 0.0 | 0.0 | 13.4 | 27.0 | 12.7 | 11.0 | ||
| 1989 | 0.0 | 4.3 | 23.6 | 40.8 | 28.3 | 32.2 | 30.3 | 24.7 | 33.3 | 11.8 | 1.3 | 0.0 | 1.7 | 31.4 | 29.2 | 16.1 | 20.2 | ||
| 1988 | 1.7 | 2.6 | 37.6 | 33.2 | 33.2 | 29.7 | 30.2 | 28.0 | 37.6 | 21.9 | 3.5 | 0.0 | 1.6 | 34.3 | 29.3 | 21.1 | 21.3 | ||
| 1987 | 0.0 | 0.0 | 35.2 | 49.2 | 37.3 | 37.0 | 45.6 | 32.1 | 33.5 | 23.5 | 3.5 | 1.5 | 1.3 | 40.3 | 37.8 | 19.8 | 30.1 | ||
| 1986 | 0.0 | 0.0 | 9.4 | 30.6 | 38.3 | 20.6 | 17.4 | 22.2 | 6.5 | 11.8 | 0.0 | 0.0 | 0.0 | 25.0 | 20.4 | 7.2 | 13.9 | ||
| 1985 | 0.0 | 3.3 | 1.9 | 7.0 | 7.0 | 5.0 | 12.5 | 17.6 | 0.0 | 0.0 | 0.0 | 0.0 | 1.1 | 5.6 | 8.2 | 0.0 | 4.7 | ||
| 1984 | 0.0 | 0.0 | 0.0 | 0.0 | 0.0 | 0.0 | 0.0 | 0.0 | 11.1 | 2.9 | 0.0 | 0.0 | 0.0 | 0.0 | 0.0 | 4.3 | 1.7 | ||
| 1983 | 0.0 | 0.0 | 0.0 | 0.0 | 33.3 | 15.4 | 0.0 | 9.1 | 0.0 | - | 0.0 | 0.0 | 0.0 | 11.1 | 10.0 | 0.0 | 6.0 | ||
| 1982 | - | 0.0 | - | 0.0 | 0.0 | 0.0 | - | 0.0 | - | 0.0 | - | 0.0 | 0.0 | 0.0 | 0.0 | 0.0 | 0.0 | ||
Breeding data
Breeding records by month
Number of breeding records by breeding code and month, 2017 and all years| Breeding code | Jul | Aug | Sep | Oct | Nov | Dec | Jan | Feb | Mar | Apr | May | Jun |
|---|---|---|---|---|---|---|---|---|---|---|---|---|
| 2017 | ||||||||||||
| Breeding (BLA code) | 0 | 0 | 0 | 0 | 0 | 0 | 0 | 0 | 0 | 0 | 0 | 0 |
| Carrying Food | 0 | 0 | 0 | 0 | 1 | 1 | 5 | 0 | 0 | 0 | 0 | 0 |
| Copulating | 0 | 0 | 0 | 0 | 0 | 0 | 0 | 0 | 0 | 0 | 0 | 0 |
| Display | 0 | 0 | 0 | 0 | 0 | 0 | 0 | 0 | 0 | 0 | 0 | 0 |
| Dependent young | 0 | 0 | 0 | 0 | 0 | 2 | 20 | 5 | 0 | 0 | 0 | 0 |
| Faecal sac | 0 | 0 | 0 | 0 | 0 | 0 | 0 | 0 | 0 | 0 | 0 | 0 |
| Inspecting hollow | 0 | 0 | 0 | 0 | 0 | 0 | 0 | 0 | 0 | 0 | 0 | 0 |
| Nest building | 0 | 0 | 0 | 0 | 4 | 3 | 0 | 0 | 0 | 0 | 0 | 0 |
| Nest with eggs | 0 | 0 | 0 | 0 | 0 | 0 | 0 | 0 | 0 | 0 | 0 | 0 |
| Nest with young | 0 | 0 | 0 | 0 | 1 | 10 | 4 | 0 | 0 | 0 | 0 | 0 |
| On/leaving nest | 0 | 0 | 0 | 0 | 6 | 8 | 2 | 0 | 0 | 0 | 0 | 0 |
| All years | ||||||||||||
| Breeding (BLA code) | 0 | 0 | 2 | 3 | 3 | 5 | 2 | 1 | 0 | 0 | 0 | 0 |
| Carrying Food | 0 | 0 | 0 | 4 | 5 | 6 | 14 | 0 | 0 | 0 | 0 | 0 |
| Copulating | 0 | 0 | 0 | 0 | 0 | 0 | 0 | 0 | 0 | 0 | 0 | 0 |
| Display | 0 | 0 | 0 | 2 | 1 | 0 | 0 | 0 | 0 | 0 | 0 | 0 |
| Dependent young | 0 | 0 | 0 | 3 | 10 | 48 | 98 | 34 | 7 | 0 | 0 | 0 |
| Faecal sac | 0 | 0 | 0 | 0 | 0 | 0 | 1 | 0 | 0 | 0 | 0 | 0 |
| Inspecting hollow | 0 | 0 | 0 | 0 | 0 | 0 | 0 | 0 | 0 | 0 | 0 | 0 |
| Nest building | 0 | 0 | 7 | 55 | 41 | 21 | 2 | 0 | 0 | 0 | 0 | 0 |
| Nest with eggs | 0 | 0 | 0 | 6 | 14 | 9 | 2 | 0 | 0 | 0 | 0 | 0 |
| Nest with young | 0 | 0 | 0 | 7 | 17 | 47 | 16 | 1 | 1 | 0 | 0 | 0 |
| On/leaving nest | 0 | 0 | 0 | 30 | 56 | 44 | 18 | 1 | 0 | 0 | 0 | 0 |
Breeding records by year
Average number of breeding records per period by breeding code| Period | Breeding (BLA code) | Carrying Food | Copulating | Display | Dependent young | Faecal sac | Inspecting hollow | Nest building | Nest with eggs | Nest with young | On/leaving nest |
|---|---|---|---|---|---|---|---|---|---|---|---|
| All years | |||||||||||
| All | 0.4 | 0.8 | 0.0 | 0.1 | 5.6 | 0.0 | 0.0 | 3.5 | 0.9 | 2.5 | 4.1 |
| Previous years | |||||||||||
| All previous years | 0.5 | 0.6 | 0.0 | 0.1 | 4.9 | 0.0 | 0.0 | 3.4 | 0.9 | 2.1 | 3.8 |
| Previous 30 years | 0.5 | 0.7 | 0.0 | 0.1 | 5.8 | 0.0 | 0.0 | 3.9 | 1.0 | 2.4 | 4.4 |
| Previous 20 years | 0.8 | 0.9 | 0.0 | 0.1 | 5.2 | 0.0 | 0.0 | 3.9 | 0.4 | 2.1 | 6.0 |
| 10 year groups | |||||||||||
| [2007,2017) | 0.8 | 0.9 | 0.0 | 0.1 | 7.2 | 0.1 | 0.0 | 6.3 | 0.6 | 3.3 | 7.1 |
| [1997,2007) | 0.8 | 1.0 | 0.0 | 0.1 | 3.3 | 0.0 | 0.0 | 1.4 | 0.2 | 0.9 | 4.8 |
| [1987,1997) | 0.0 | 0.3 | 0.0 | 0.1 | 6.8 | 0.0 | 0.0 | 4.1 | 2.3 | 3.0 | 1.4 |
| 5 year groups | |||||||||||
| [2012,2017) | 0.8 | 0.8 | 0.0 | 0.2 | 9.6 | 0.0 | 0.0 | 7.0 | 1.0 | 4.6 | 7.6 |
| [2007,2012) | 0.8 | 1.0 | 0.0 | 0.0 | 4.8 | 0.2 | 0.0 | 5.6 | 0.2 | 2.0 | 6.6 |
| [2002,2007) | 0.2 | 1.4 | 0.0 | 0.2 | 2.4 | 0.0 | 0.0 | 1.6 | 0.0 | 1.4 | 3.4 |
| [1997,2002) | 1.4 | 0.6 | 0.0 | 0.0 | 4.2 | 0.0 | 0.0 | 1.2 | 0.4 | 0.4 | 6.2 |
| [1992,1997) | 0.0 | 0.0 | 0.0 | 0.2 | 1.6 | 0.0 | 0.0 | 1.0 | 0.4 | 0.2 | 2.8 |
| [1987,1992) | 0.0 | 0.6 | 0.0 | 0.0 | 12.0 | 0.0 | 0.0 | 7.2 | 4.2 | 5.8 | 0.0 |
| Year | |||||||||||
| 2017 | 0.0 | 7.0 | 0.0 | 0.0 | 27.0 | 0.0 | 0.0 | 7.0 | 0.0 | 15.0 | 16.0 |
| 2016 | 0.0 | 2.0 | 0.0 | 0.0 | 20.0 | 0.0 | 0.0 | 9.0 | 1.0 | 15.0 | 13.0 |
| 2015 | 0.0 | 0.0 | 0.0 | 1.0 | 8.0 | 0.0 | 0.0 | 13.0 | 1.0 | 2.0 | 7.0 |
| 2014 | 0.0 | 2.0 | 0.0 | 0.0 | 11.0 | 0.0 | 0.0 | 7.0 | 1.0 | 3.0 | 9.0 |
| 2013 | 2.0 | 0.0 | 0.0 | 0.0 | 4.0 | 0.0 | 0.0 | 2.0 | 1.0 | 2.0 | 4.0 |
| 2012 | 2.0 | 0.0 | 0.0 | 0.0 | 5.0 | 0.0 | 0.0 | 4.0 | 1.0 | 1.0 | 5.0 |
| 2011 | 0.0 | 1.0 | 0.0 | 0.0 | 6.0 | 1.0 | 0.0 | 6.0 | 0.0 | 3.0 | 12.0 |
| 2010 | 1.0 | 1.0 | 0.0 | 0.0 | 4.0 | 0.0 | 0.0 | 2.0 | 0.0 | 1.0 | 1.0 |
| 2009 | 1.0 | 0.0 | 0.0 | 0.0 | 5.0 | 0.0 | 0.0 | 9.0 | 0.0 | 2.0 | 8.0 |
| 2008 | 0.0 | 1.0 | 0.0 | 0.0 | 6.0 | 0.0 | 0.0 | 6.0 | 0.0 | 1.0 | 7.0 |
| 2007 | 2.0 | 2.0 | 0.0 | 0.0 | 3.0 | 0.0 | 0.0 | 5.0 | 1.0 | 3.0 | 5.0 |
| 2006 | 0.0 | 3.0 | 0.0 | 0.0 | 4.0 | 0.0 | 0.0 | 4.0 | 0.0 | 1.0 | 1.0 |
| 2005 | 0.0 | 1.0 | 0.0 | 1.0 | 1.0 | 0.0 | 0.0 | 1.0 | 0.0 | 3.0 | 3.0 |
| 2004 | 1.0 | 1.0 | 0.0 | 0.0 | 4.0 | 0.0 | 0.0 | 2.0 | 0.0 | 1.0 | 1.0 |
| 2003 | 0.0 | 1.0 | 0.0 | 0.0 | 1.0 | 0.0 | 0.0 | 1.0 | 0.0 | 2.0 | 8.0 |
| 2002 | 0.0 | 1.0 | 0.0 | 0.0 | 2.0 | 0.0 | 0.0 | 0.0 | 0.0 | 0.0 | 4.0 |
| 2001 | 2.0 | 0.0 | 0.0 | 0.0 | 5.0 | 0.0 | 0.0 | 1.0 | 0.0 | 1.0 | 4.0 |
| 2000 | 5.0 | 0.0 | 0.0 | 0.0 | 5.0 | 0.0 | 0.0 | 2.0 | 0.0 | 0.0 | 7.0 |
| 1999 | 0.0 | 2.0 | 0.0 | 0.0 | 10.0 | 0.0 | 0.0 | 2.0 | 0.0 | 1.0 | 16.0 |
| 1998 | 0.0 | 0.0 | 0.0 | 0.0 | 1.0 | 0.0 | 0.0 | 0.0 | 2.0 | 0.0 | 3.0 |
| 1997 | 0.0 | 1.0 | 0.0 | 0.0 | 0.0 | 0.0 | 0.0 | 1.0 | 0.0 | 0.0 | 1.0 |
| 1996 | 0.0 | 0.0 | 0.0 | 0.0 | 1.0 | 0.0 | 0.0 | 2.0 | 1.0 | 0.0 | 3.0 |
| 1995 | 0.0 | 0.0 | 0.0 | 0.0 | 1.0 | 0.0 | 0.0 | 0.0 | 1.0 | 0.0 | 4.0 |
| 1994 | 0.0 | 0.0 | 0.0 | 0.0 | 3.0 | 0.0 | 0.0 | 0.0 | 0.0 | 1.0 | 6.0 |
| 1993 | 0.0 | 0.0 | 0.0 | 0.0 | 3.0 | 0.0 | 0.0 | 3.0 | 0.0 | 0.0 | 0.0 |
| 1992 | 0.0 | 0.0 | 0.0 | 1.0 | 0.0 | 0.0 | 0.0 | 0.0 | 0.0 | 0.0 | 1.0 |
| 1991 | 0.0 | 0.0 | 0.0 | 0.0 | 3.0 | 0.0 | 0.0 | 0.0 | 0.0 | 0.0 | 0.0 |
| 1990 | 0.0 | 0.0 | 0.0 | 0.0 | 6.0 | 0.0 | 0.0 | 2.0 | 1.0 | 2.0 | 0.0 |
| 1989 | 0.0 | 1.0 | 0.0 | 0.0 | 16.0 | 0.0 | 0.0 | 19.0 | 4.0 | 3.0 | 0.0 |
| 1988 | 0.0 | 1.0 | 0.0 | 0.0 | 14.0 | 0.0 | 0.0 | 7.0 | 7.0 | 7.0 | 0.0 |
| 1987 | 0.0 | 1.0 | 0.0 | 0.0 | 21.0 | 0.0 | 0.0 | 8.0 | 9.0 | 17.0 | 0.0 |
| 1986 | 0.0 | 0.0 | 0.0 | 0.0 | 0.0 | 0.0 | 0.0 | 0.0 | 0.0 | 1.0 | 0.0 |
| 1985 | 0.0 | 0.0 | 0.0 | 0.0 | 0.0 | 0.0 | 0.0 | 1.0 | 0.0 | 1.0 | 0.0 |
| 1984 | 0.0 | 0.0 | 0.0 | 0.0 | 0.0 | 0.0 | 0.0 | 0.0 | 0.0 | 0.0 | 0.0 |
| 1983 | 0.0 | 0.0 | 0.0 | 0.0 | 0.0 | 0.0 | 0.0 | 0.0 | 0.0 | 0.0 | 0.0 |
| 1982 | 0.0 | 0.0 | 0.0 | 0.0 | 0.0 | 0.0 | 0.0 | 0.0 | 0.0 | 0.0 | 0.0 |
Distribution map
Distribution - 2017
This map shows the observed distribution of the Noisy Friarbird for 2017.
The red circles are the grid cells where Noisy Friarbird have been reported.
The transparency of the red circles indicate how many surveys sheets were submitted for that grid cell; the darker the red the more reliable the data. Of the 315 grid cells with reports, 83 had only one sheet; an example is grid number E3.
The size of the circle represents the reporting rate. The maximum reporting rate for Noisy Friarbird was 100.0% (eg grid number E3) and the minimum was 0.5% (eg grid number L12). 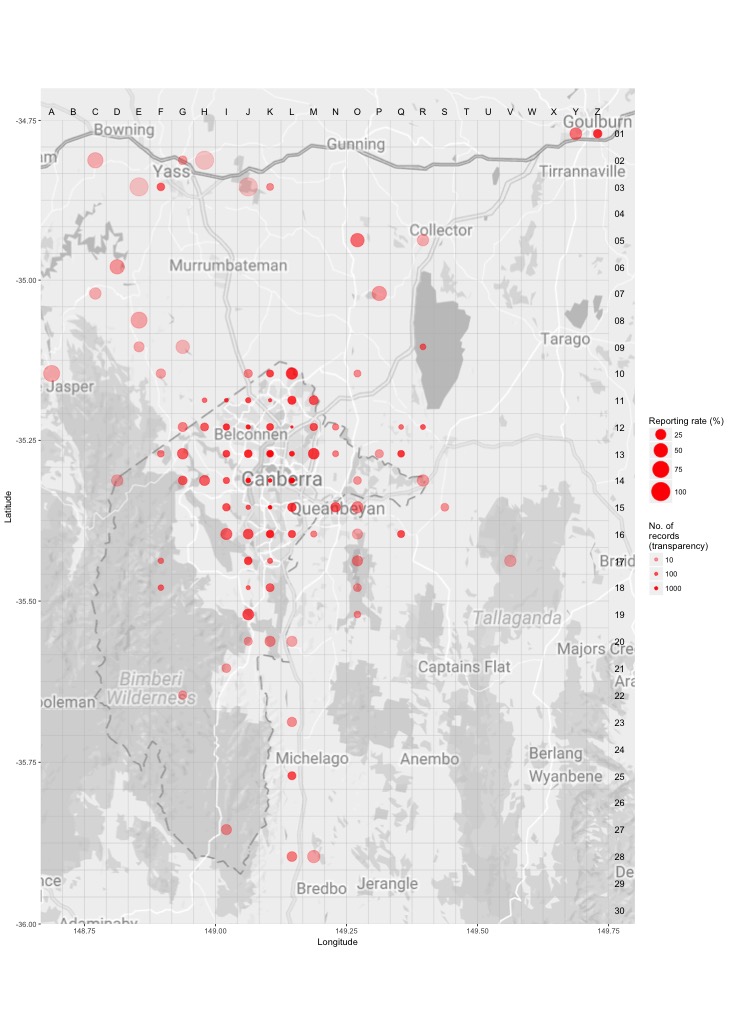
Distribution - all years
This map shows the observed distribution of the Noisy Friarbird for all years.
The red circles are the grid cells where Noisy Friarbird have been reported.
The transparency of the red circles indicate how many surveys sheets were submitted for that grid cell; the darker the red the more reliable the data. Of the 703 grid cells with reports, 55 had only one sheet; an example is grid number W16.
The size of the circle represents the reporting rate. The maximum reporting rate for Noisy Friarbird was 100.0% (eg grid number R19) and the minimum was 0.5% (eg grid number S13). 
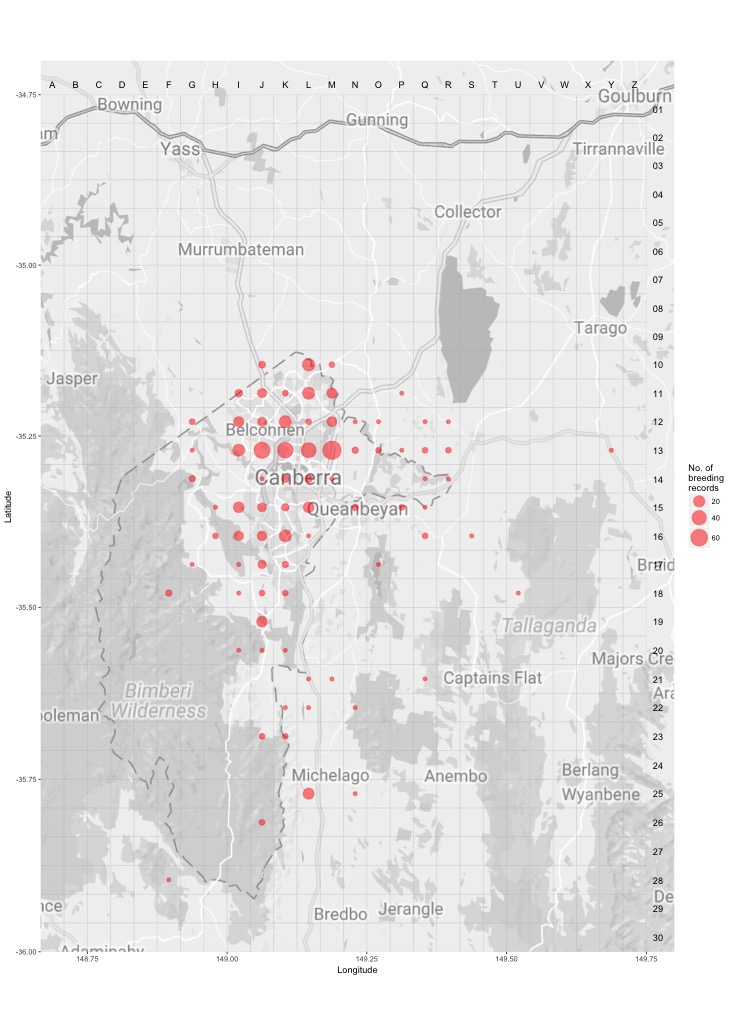
Breeding map
Breeding - 2017
This map shows the breeding distribution of the Noisy Friarbird for 2017.
The red circles are the grid cells where breeding activity for Noisy Friarbird have been reported.
The size of the circle represents the number of reports. 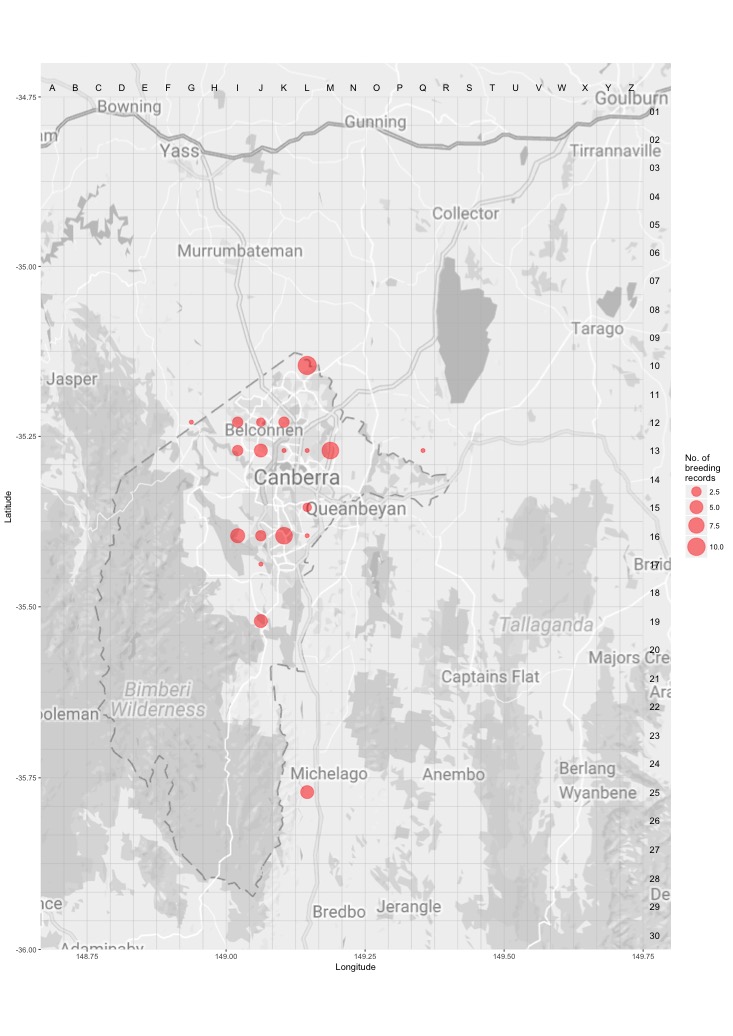
Breeding - all years
This map shows the breeding distribution of the Noisy Friarbird for all years.
The red circles are the grid cells where breeding activity for Noisy Friarbird have been reported.
The size of the circle represents the number of reports.